Share Structure
| As at July 31, 2019 | |
|---|---|
| Shares Outstanding | 40.6M |
| Options | 4.0M |
| Warrants | 15.3M |
| Broker Warrants | 0.1M |
| Fully Diluted | 60.0M |
| As at July 31, 2019 | |
|---|---|
| Shares Outstanding | 40.6M |
| Options | 4.0M |
| Warrants | 15.3M |
| Broker Warrants | 0.1M |
| Fully Diluted | 60.0M |
The Company engaged TRU Group Inc (“TRU”) to complete the Project’s PEA. A PEA, by regulation, includes an economic analysis of the potential viability of the Project’s mineral resources and the use of inferred resources is allowed. The final report, originally released in February 2017 and revised in July 2017, concluded that, based on exploration drilling and test work completed to date as well as various documented assumptions:
Figure 4: Project PEA Production Schematic
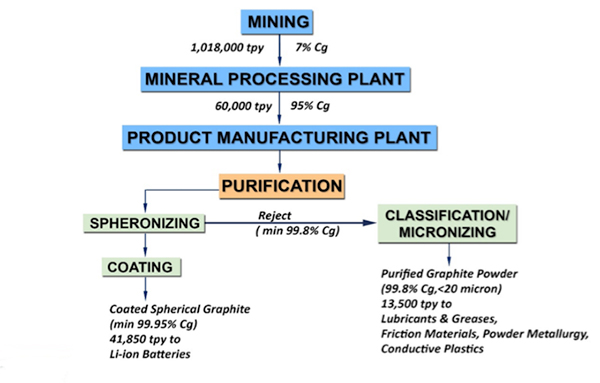
Table 5: Project's PEA Post-Tax Financial Results
| Summary of the Project’s Post-Tax Financial Results (US$ Million) | |
|---|---|
| NPV of Net Cash Flow (10% Discount Rate) | $616 |
| Internal Rate of Return | 22% |
| Payback Period in Production Year | 4 |